


Connecting Michigan, One Tower at a Time
Colocation and Build-to-Suit Tower Sites Across the State of Michigan
The State of Michigan Tower Program gives carriers, wireless internet service providers, government agencies, and public safety organizations fast, cost-effective access to wireless infrastructure across the state. With a portfolio of 270 existing towers and 4.6 million acres of state-owned land available for new builds, we help you expand coverage and capacity exactly where Michigan needs it, from dense urban corridors to rural communities, state forests, and parks. Want to talk through your coverage goals first?
-
270
Towers Available for Colocation
-
4.6M
Acres of State Land (7,225 sq. miles)
-
140+
Towers Exceeding 400 Feet
-
4
Sectors Served: Carriers · WISPs · Government · Public Safety

Bridging Michigan's Digital Divide
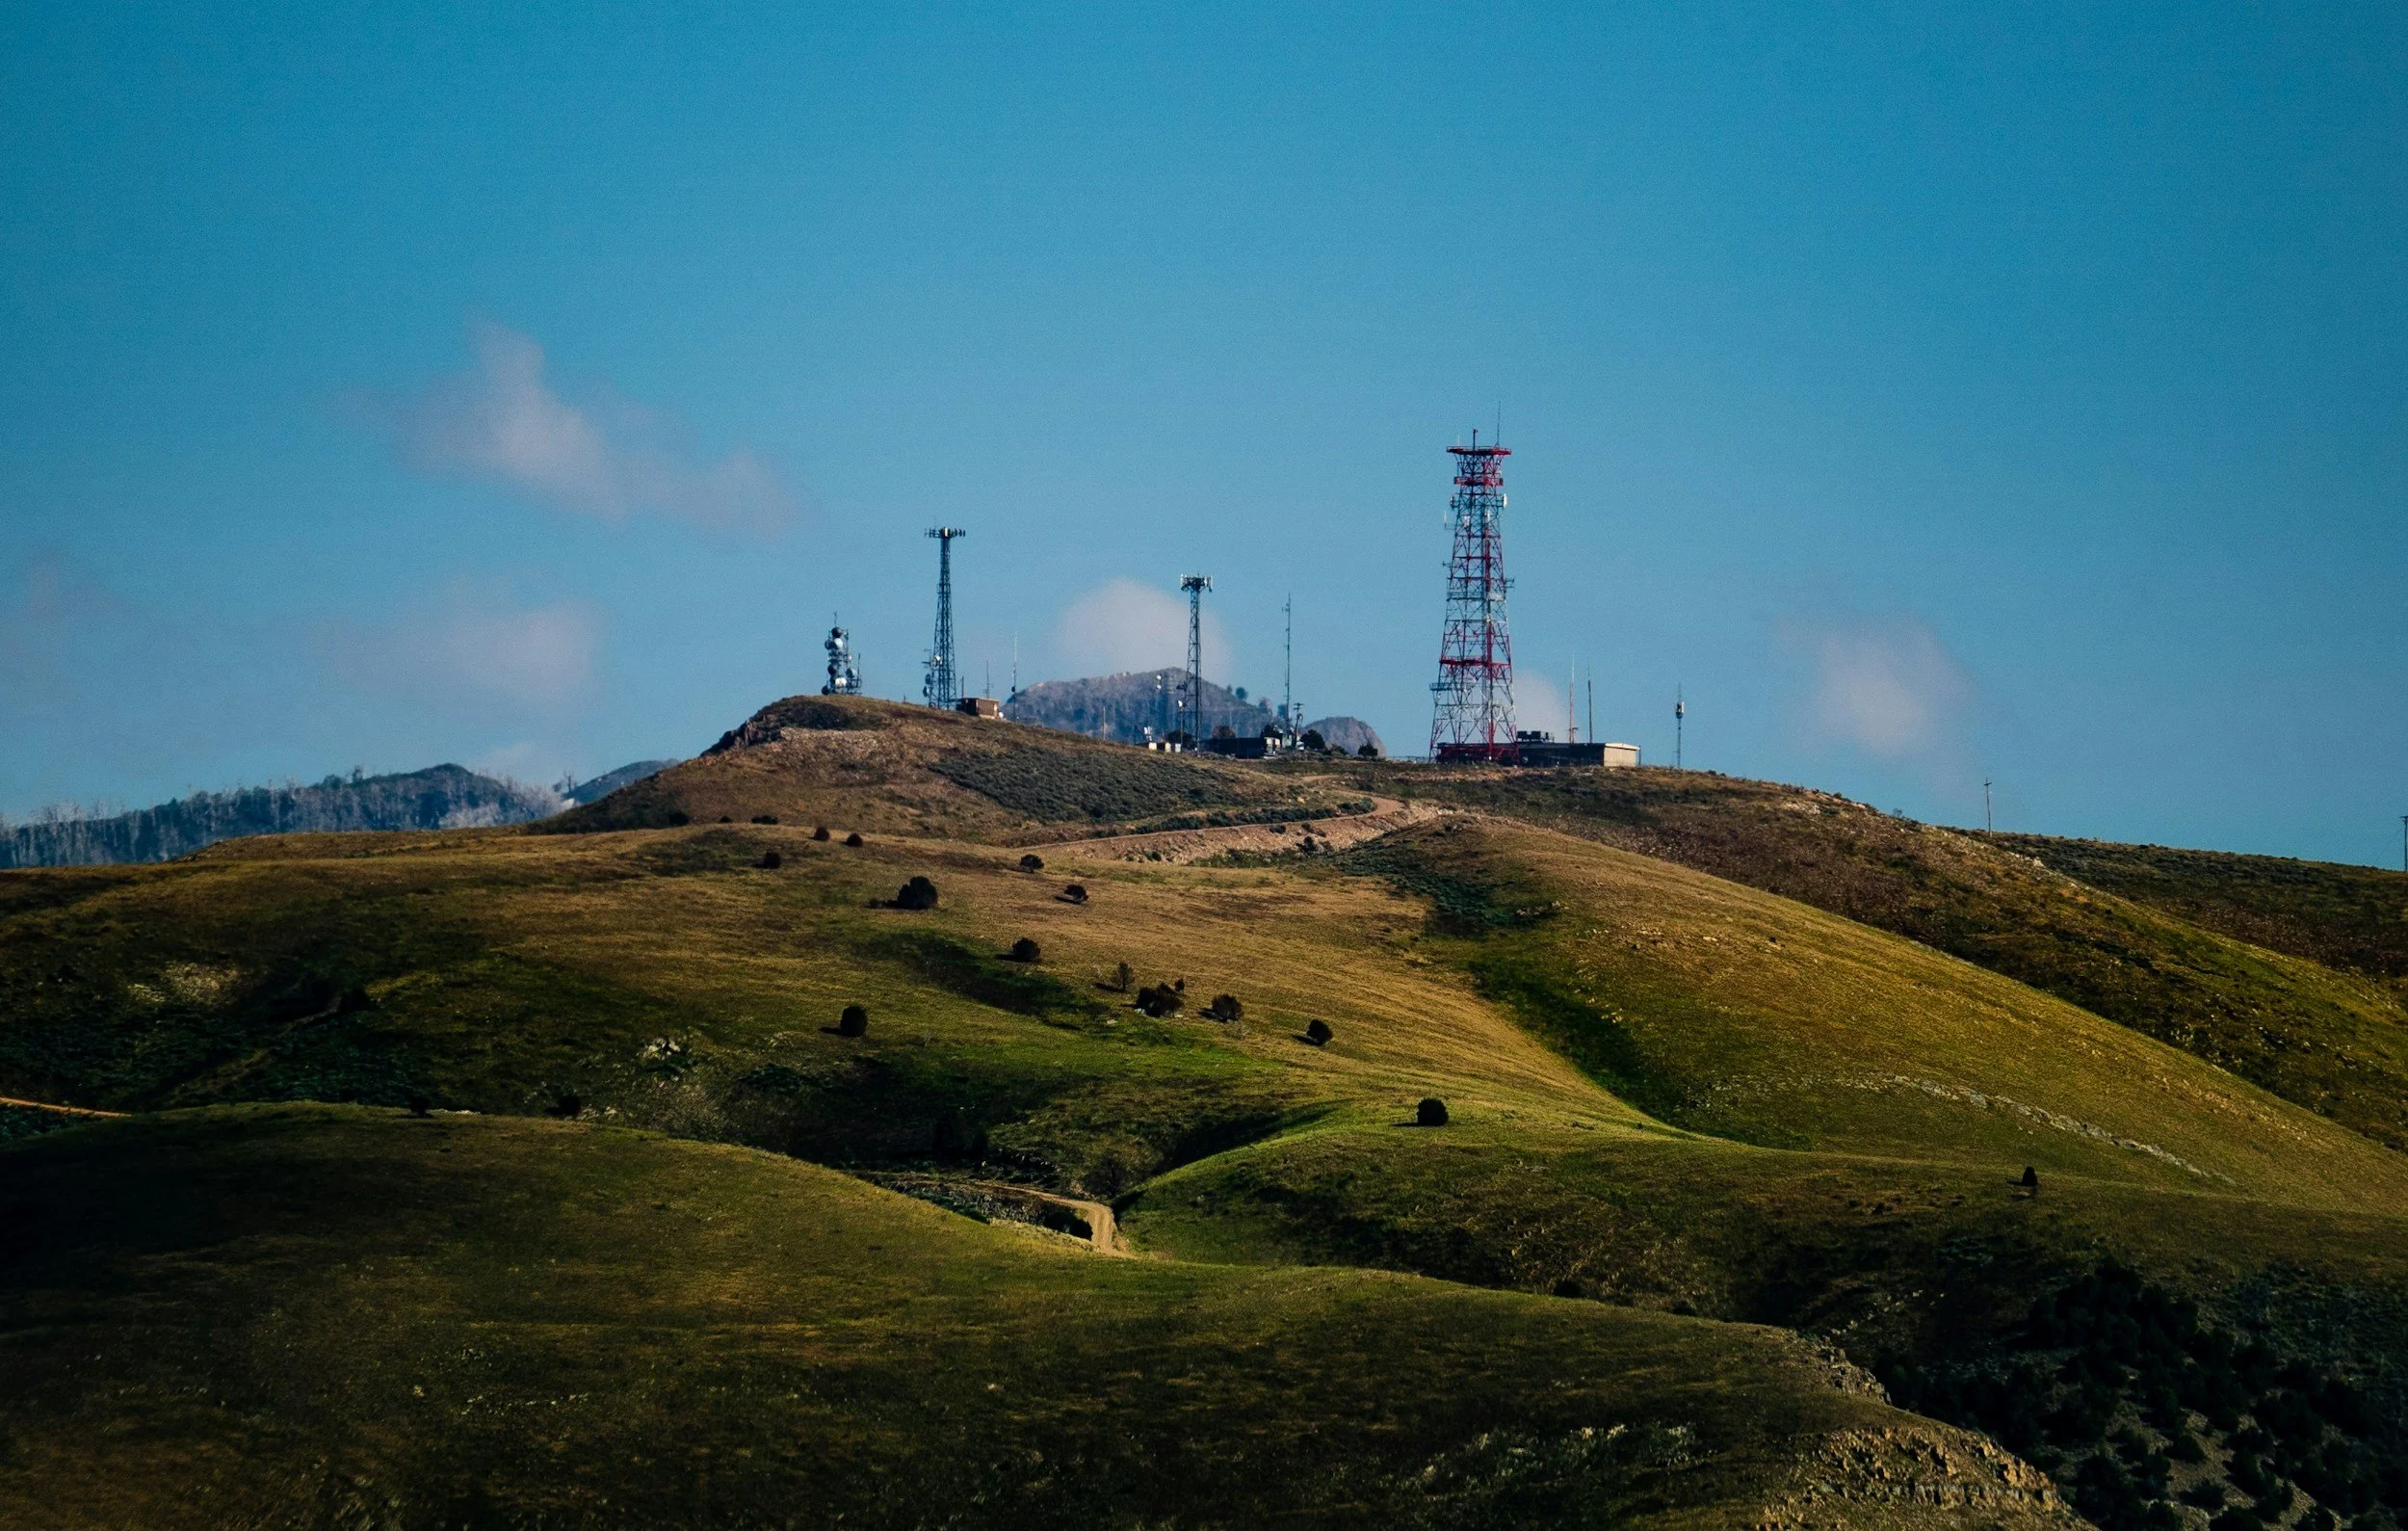
In today's digital economy, reliable connectivity isn't a luxury; it's essential infrastructure. From the heart of Detroit to Michigan's most remote state parks, residents, businesses, and first responders depend on strong wireless coverage. Yet in many rural areas, that coverage is still spotty or nonexistent.
The State of Michigan Tower Program exists to close those gaps. In partnership with Pyramid Network Services, the program strategically develops and manages tower sites across rural and suburban Michigan, expanding coverage and capacity for mobile carriers, delivering fixed wireless access for ISPs, and strengthening the communications systems that keep communities safe.
Built for the Organizations That Keep Michigan Connected
The State of Michigan Tower Program supports four key sectors, each with infrastructure needs we're equipped to meet:
-
Wireless Carriers
Expand your network footprint and add capacity without the time and cost of building from the ground up. Colocate on existing towers in strategic locations, or develop build-to-suit sites on state land where your coverage maps demand it.
-

Wireless Internet Service Providers (WISPs)
Reach underserved rural communities faster. Our tower portfolio and access to 4.6 million acres of state land give WISPs the elevation and positioning needed to deliver reliable fixed wireless broadband where wired infrastructure can't reach.
-

Government Entities
Federal, state, and local agencies, as well as MiDEAL cooperative purchasing members, can leverage the program's infrastructure to support connectivity initiatives, close the digital divide, and serve constituents across Michigan's most challenging terrain.
-

Public Safety Organizations
Emergency response depends on uninterrupted communication. Built on the same tall-tower infrastructure that supports Michigan's Public Safety Communications System, our sites help agencies maintain the reliable, wide-area coverage first responders rely on.
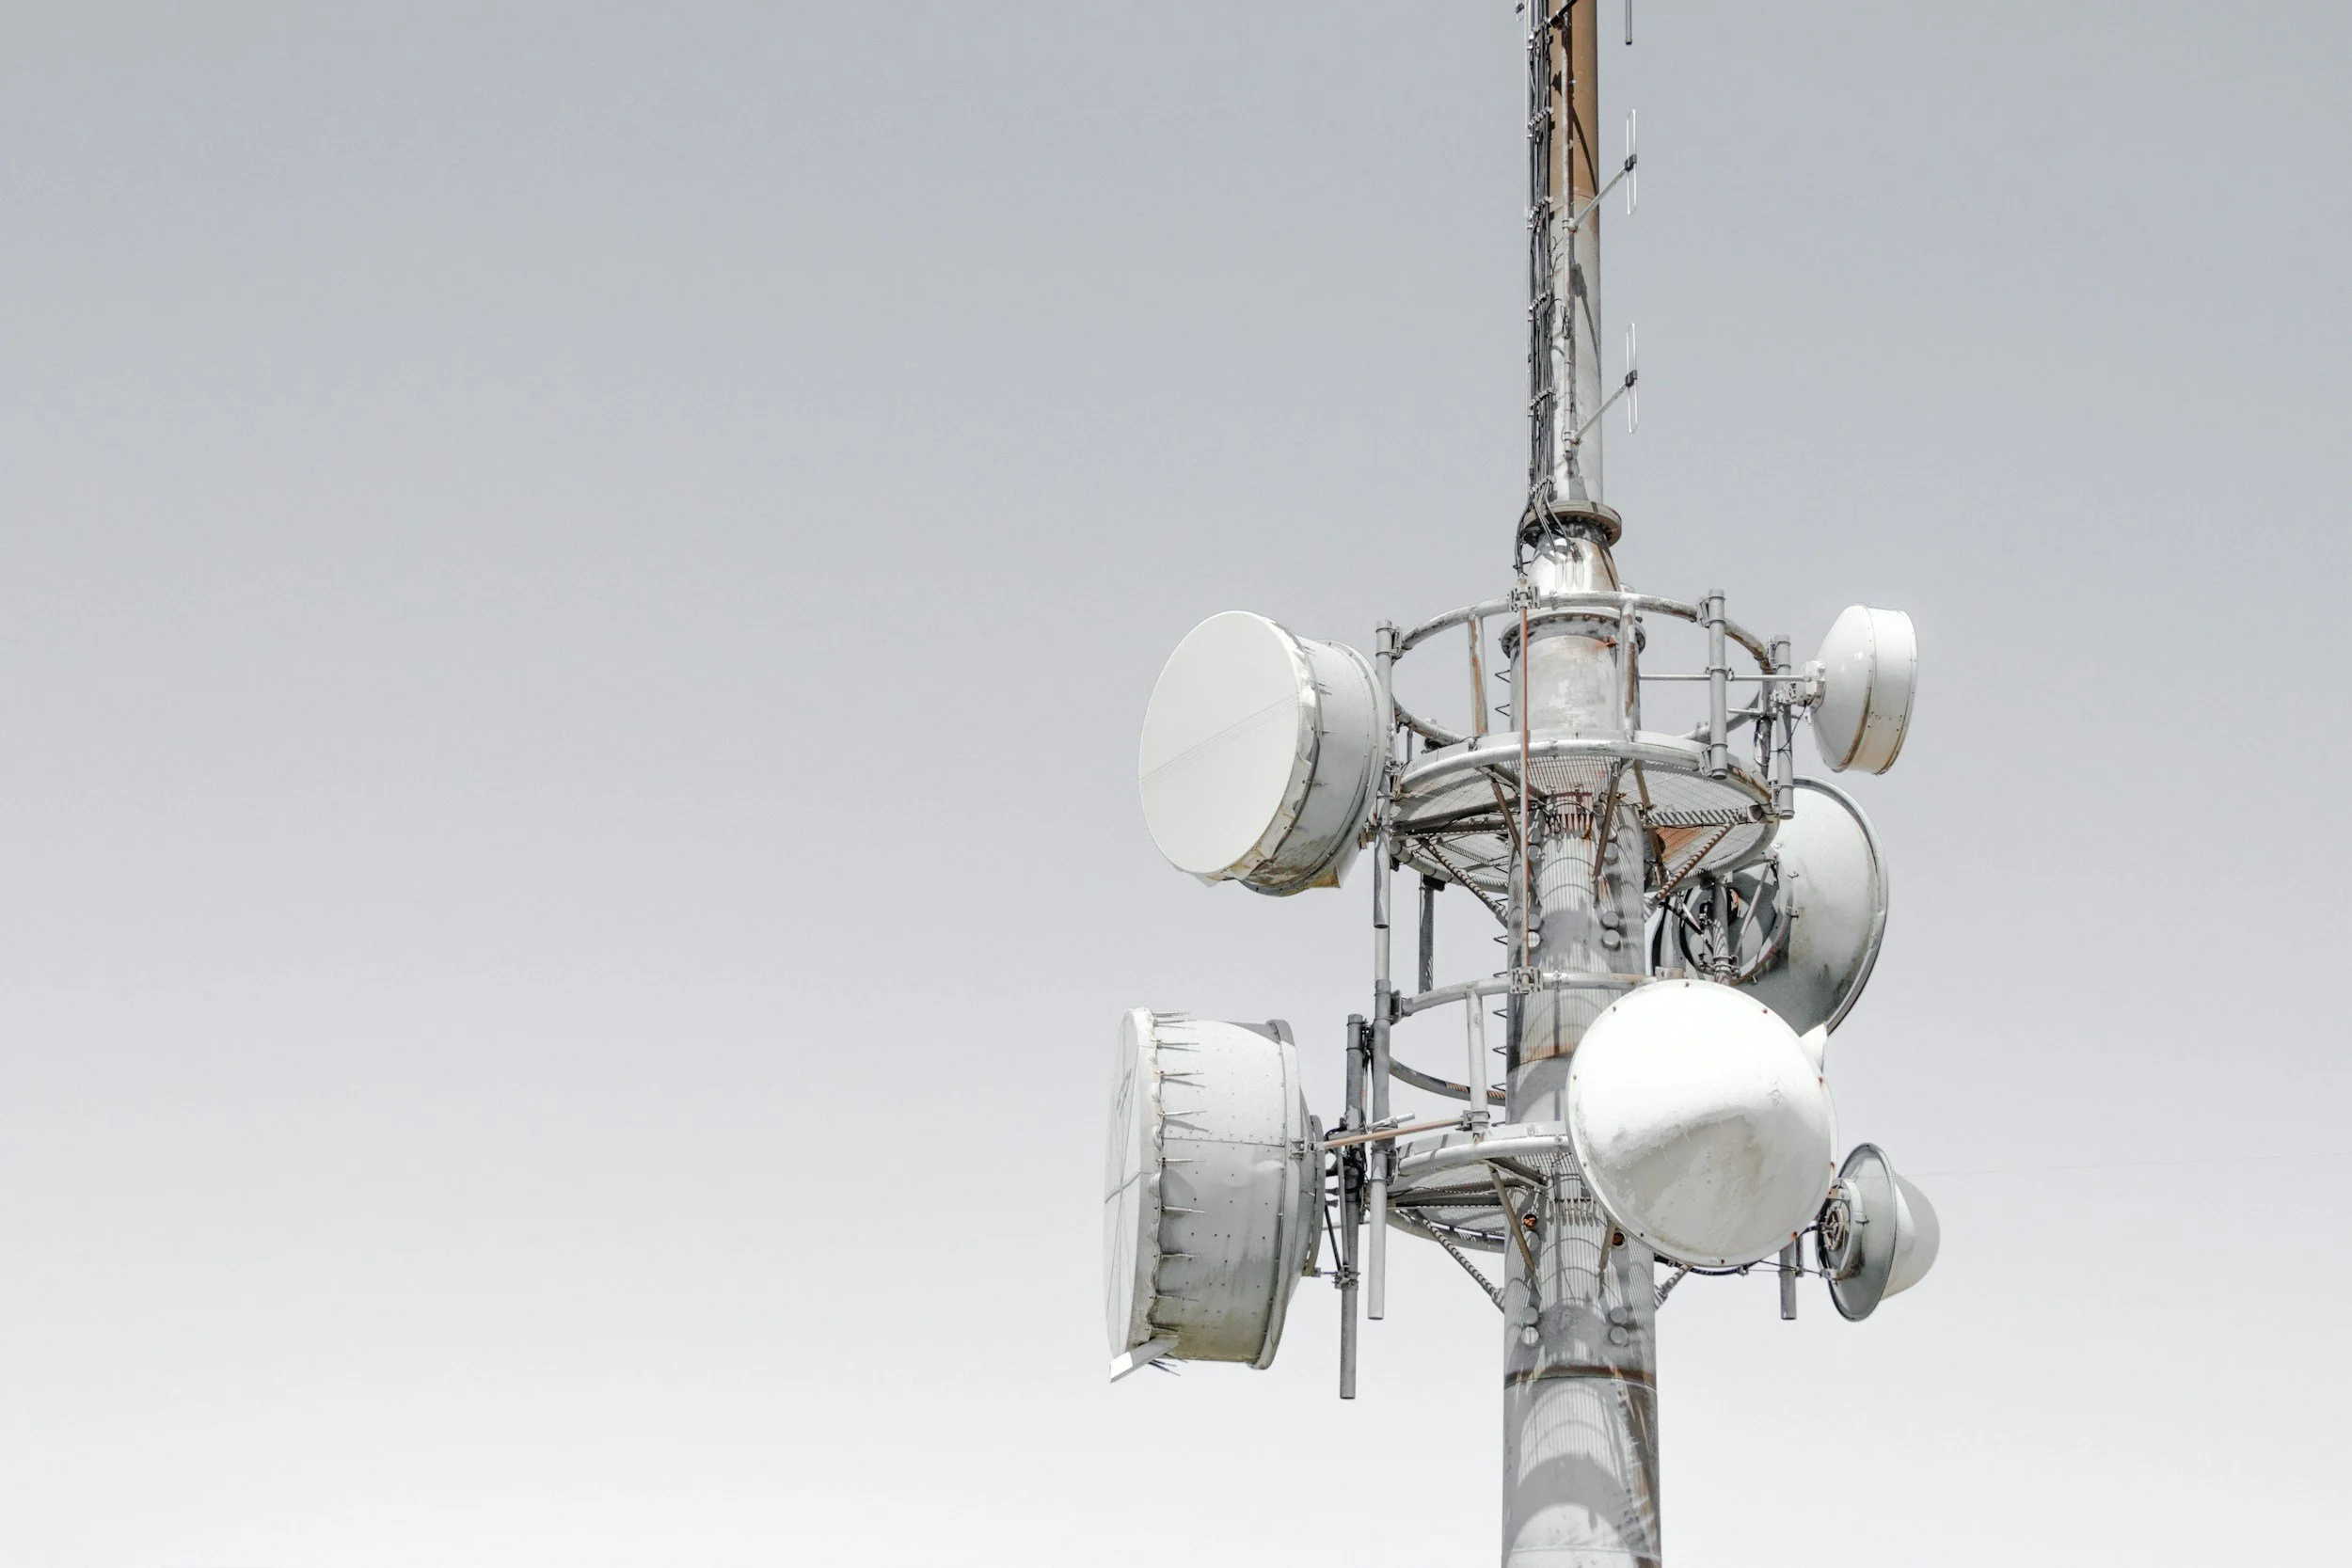
Why Colocation Matters
Colocation is a strategic solution for expanding network reach without building entirely new infrastructure. By sharing space on an existing tower, multiple service providers can deploy faster, reduce costs, and bring better service to more communities.
With 270 towers already standing across Michigan, and more than 140 of them exceeding 400 feet, colocation through the program gives tenants a broad range of RAD center heights to choose from, and the chance to be on-air in a fraction of the time and cost of a new build.
The Benefits of Colocation
We also support CBRS and DAS installations for tenants with specialized coverage and capacity needs.
-
Use infrastructure that's already permitted and standing
-
Share tower space instead of funding a full new build
-
Tap into a 270-tower portfolio positioned across the state
-
140+ towers over 400 feet for superior coverage

When Colocation Isn't Enough, Our Land Is
If our portfolio of 270 towers can't meet your needs, our land can. As the exclusive developer of new towers on state-owned property, the program offers access to 4.6 million acres — including Department of Natural Resources forest land and Department of Transportation right-of-ways along the highways carriers most want to cover.
A build-to-suit tower is the right solution when a tenant's coverage or capacity goals can't be met by existing towers and a new, purpose-built structure is required. We help identify viable locations and guide development from concept to completion.
Have a coverage target in mind? Request a GIS coverage map and we'll return several site options matched to your goals.
How the Michigan Tower Program Works
Backed by Pyramid's end-to-end project management system, the process is transparent and predictable, with clear costs and timelines communicated upfront.
A Proven Partner in Michigan Connectivity
Since 2022, Pyramid Network Services has served as the colocation management company for all state-owned towers, buildings, and properties, as well as new tower builds and CBRS and DAS installations on state-owned land. Established in 1996, Pyramid has completed work on more than 100,000 wireless sites nationwide, and has provided services to Michigan wireless carriers and public safety communications for nearly two decades. Learn more about the team behind the program.
“Our knowledge and expertise, coupled with a vast array of state-owned tower sites, right-of-ways for new site development, and other state-owned facilities, will provide a tremendous amount of access and opportunities for new coverage and capacity — and new ways of bridging the digital divide in unserved and underserved areas of Michigan.”
Join Us in Connecting Michigan
Connectivity is the foundation of thriving communities. With the State of Michigan Tower Program, every part of the state — urban, suburban, and rural — can be part of the digital world.
Whether you're a carrier expanding coverage, a WISP reaching new communities, or a government or public safety agency strengthening critical communications, our team is ready to help you meet your on-air goals.